Exploratory Data Analysis
Analysis OF PRICE ON INDEPENDENT HOUSES IN HYDERABAD
Data collected from the square yards website.
square yards, is a real estate website that helps you to buy or rent your dream house. In this website you can search for different types of houses or for villas or for independent houses.
import re
import numpy as np
import requests
from bs4 import BeautifulSoup
!pip install selenium
from selenium import webdriver
from selenium import webdriver
import re
url = 'https://www.squareyards.com/sale/independent-houses-for-sale-in-hyderabad'
page = requests.get(url)
page
soup = BeautifulSoup(page.text)
soup
you should get the page response as 200
loc = ['Kukatpally','Gachibowli','Nampalli','Ameerpet','Shankarpalli','Kondapur','Tarnaka','Nizampet','Balanagar','Cherlapally']bhk = []
location=[]
furnish = []
bathroom = []
possessionstatus = []
area = []
noofimages = []
tenantpre = []
price=[]
for x in loc:
url = f'https://www.squareyards.com/sale/independent-houses-for-sale-in-{x}-hyderabad'
driver = webdriver.Chrome(r"C:\Users\Bhavitha Cherukuri\Downloads\chromedriver_win32(1)")
driver.get(url)
soup = BeautifulSoup(driver.page_source,'html.parser')
driver.close()
a = soup.find_all("div",class_="tlBdy")#inspecting website and getting class and container code
for i in a:
text = i.text
regex = re.findall('(\d.*)\sBHK',text)
if regex:
bhk.append(regex[0])
else:
bhk.append(np.nan)
all_loc = soup.find_all("div",class_="tlBdy")
for i in all_loc:
text=i.text
regex=re.findall("Kukatpally|Gachibowli|Nampalli|Ameerpet|Shankarpalli|Kondapur|Tarnaka|Nizampet|Balanagar|Cherlapally",text)
#print(regex)
if regex:
location.append(regex[0])
else:
location.append('Balanagar')
b = soup.find_all("div",class_="tlBdy")
for i in b:
text = i.text
print(text)
regex=re.findall("Furnished|Semi-Furnished|Unfurnished",text)
#print(regex)
if regex:
furnish.append(regex[0])
else:
furnish.append('Semi-Furnished')
b = soup.find_all("div",class_="tlBdy")
for i in b:
text = i.text
regex=re.findall(",?\s(\d)\s?bathroom|bathrooms",text)#regex for particular value
#print(regex)
if regex:
bathroom.append(regex[0])
else:
bathroom.append(2)
b = soup.find_all("ul",class_="tlPrjctUl")
for i in b:
text = i.text
print(text)
regex=re.findall("(Ready To Move| Under Construction)",text)
#print(regex)
if regex:
possessionstatus.append(regex[0])
else:
possessionstatus.append('Under Construction')
for i in b:
text = i.text
regex=re.findall("(\d.*)\sSq",text)
#print(regex)
if regex:
area.append(regex[0])
else:
area.append('2023')
b = soup.find_all("div",class_="tlBdy")
for i in b:
text = i.text
regex=re.findall("(\d+)\s\s",text)
if regex:
noofimages.append(regex[0])
else:
noofimages.append(0)
for i in b:
text = i.text
regex=re.findall("(?:Bachelors|Bachelors/Family|Family)",text)
#print(regex)
if regex:
tenantpre.append(regex[0])
else:
tenantpre.append('Bachelors')
for i in b:
text=i.text
regex=re.findall("₹\s(\d.*)",text)
if regex:
price.append(regex[0])
else:
price.append(0)Now by using the all the variables used u can print the details related to them.
creating a data frame
data={"location":location,"furnish":furnish,"bathroom":bathroom,"tenantpre":tenantpre,"bhk":bhk,"possessionstatus":possessionstatus,"area":area,"noofimages":noofimages,"price":price}importing the libraries
houses = pd.DataFrame(data)
houses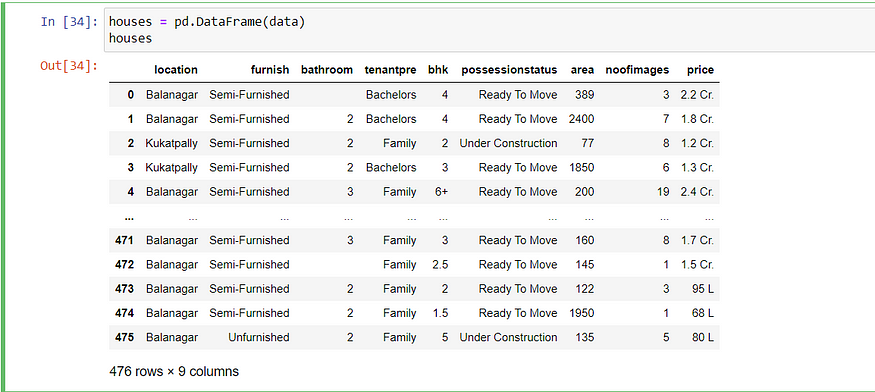
houses.info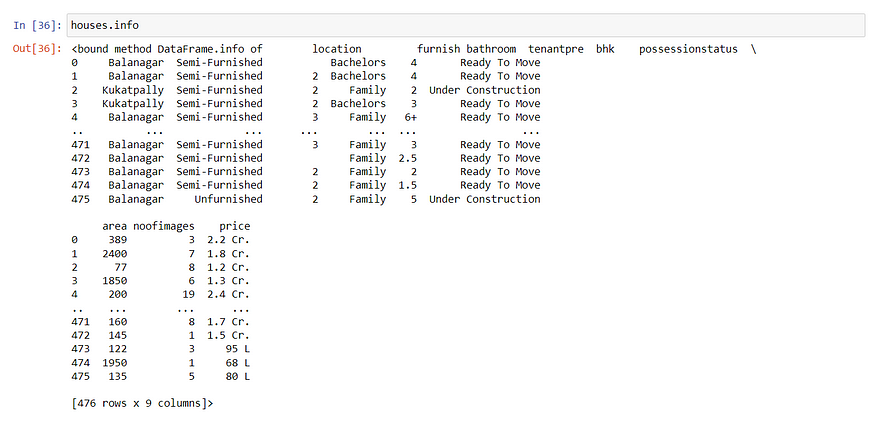
#converting csv data for rentals dataframe
houses_csv_data = houses.to_csv('houses_project2.csv', index = True)
print('\nCSV String:\n', houses_csv_data)
Reading csv file
df = pd.read_csv('houses_project2.csv')
df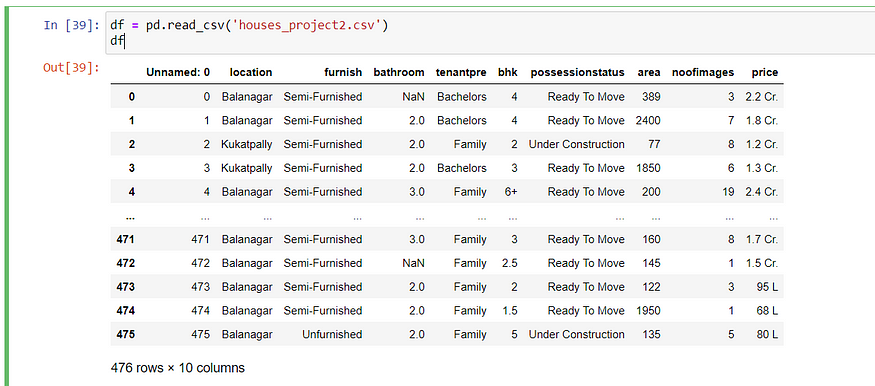
Cleaning the data by removing special symbols and null values
df['bhk']=df['bhk'].str.replace('+',' ')
df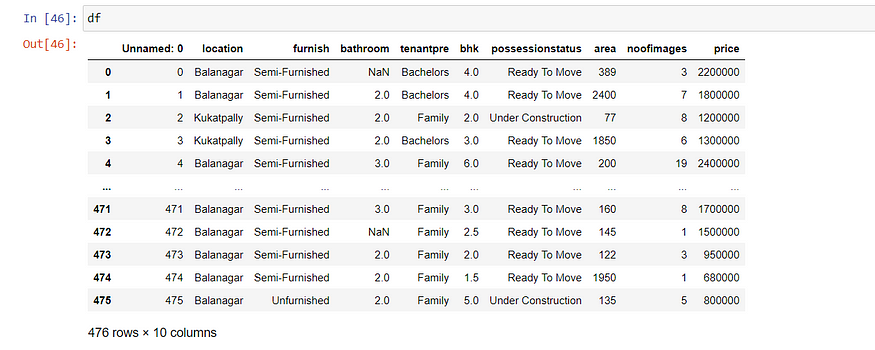
I have shown only one step and there are few more columns to clean the data and Now the data is cleaned as shown in above picture.
Dropping unnecessary columns
df.drop(['Unnamed: 0' ],axis = 1,inplace=True)checking for outliers
df.isnull().sum()
Removing outliers from data fram using minimum and maximum iqr of numerical values
import seaborn as snsiqr_df = df['bathroom'].describe().loc['75%'] - df['bathroom'].describe().loc['25%']
iqr_df ufbathroom = df['bathroom'].describe().loc['75%'] + iqr_df*1.5
ufbathroomlfbathroom = df['bathroom'].describe().loc['25%'] - iqr_df*1.5
lfbathroomdf = df[df['bathroom']<ufbathroom]
df.shape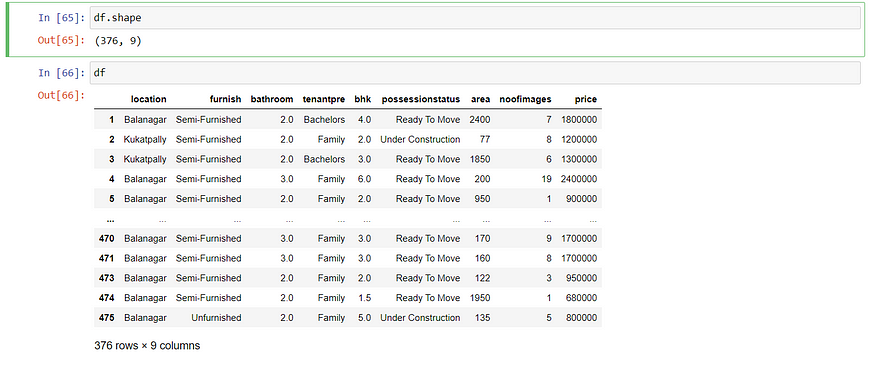
By continuing this process the data is cleaned
df.isnull().sum()
import matplotlib.pyplot as plt
import seaborn as snssns.histplot(df['area']) # there is more demand for area = 1500, as the count is 80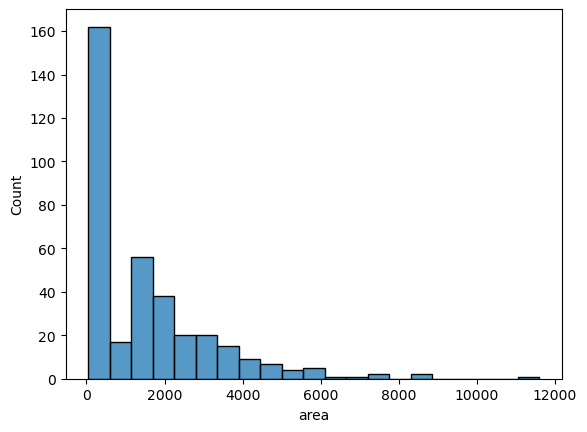
sns.kdeplot(df["bathroom"],color='r',shade=True)# there is demand for houses with 2 bathroom 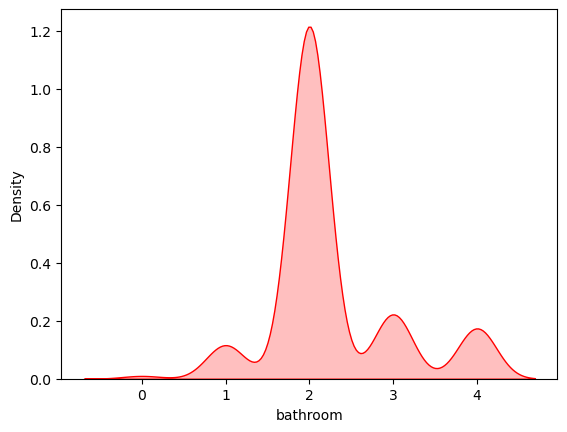
plt.figure(figsize=(10,4)) # there is more demand for houses in Balanagar
sns.countplot(x='location',data=df)
plt.title("count of locations")
plt.xticks(rotation=90)
plt.show()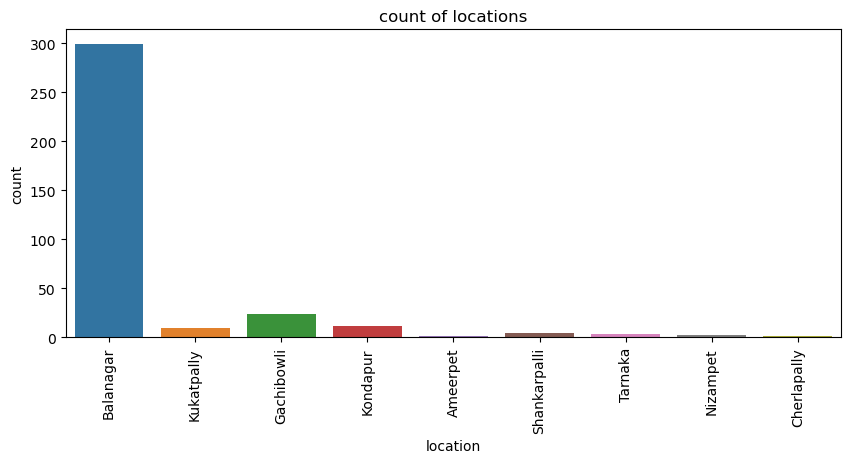
sns.countplot(df['tenantpre']) # most of the houses are for families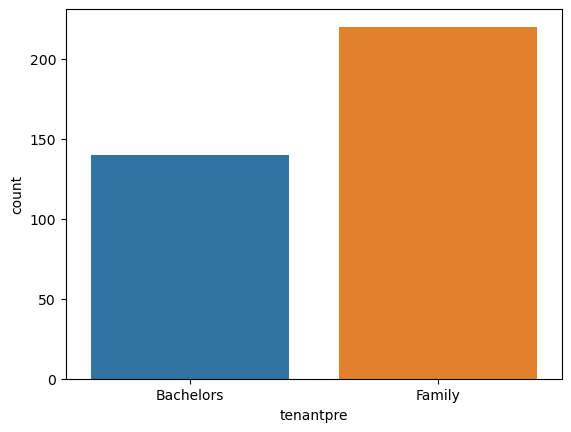
df['furnish'].value_counts().plot(kind = 'bar') # the houses that are unfurnished are more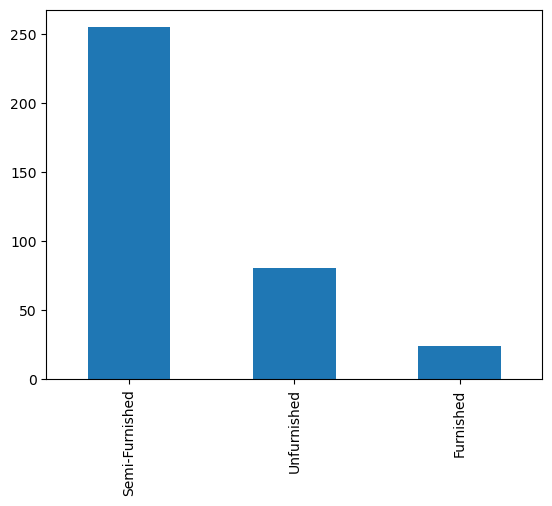
sns.boxplot(df['tenantpre'],df['area'],hue=df['bathroom']) # most of the families are preffering 2 bathroom and bachelors 3 bathrooms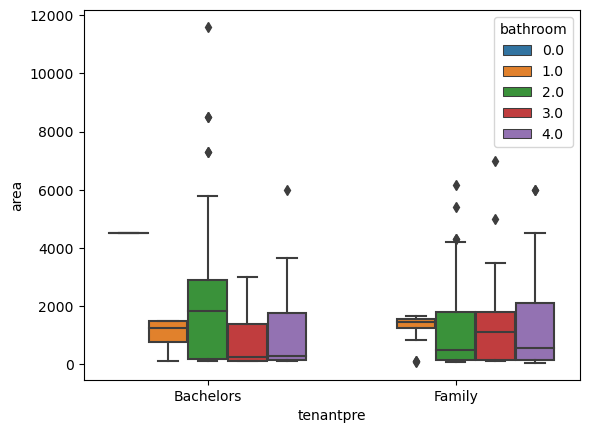
sns.heatmap(df.corr(),
            annot=True,
            fmt = '.2f',)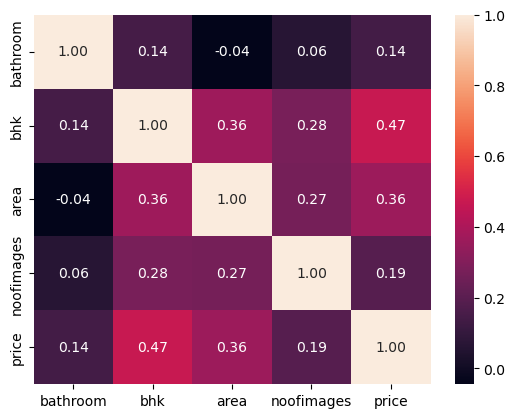
And thus there is more demand for houses in balanagar and most of the houses are semi-furnished. As, these are some insights and go through the story to find out more insights.

No comments:
Post a Comment